Nested Groups
The Nested Groups interactive enables visualization of multiplication as the nesting of dots into one or two dimensional arrays. A grid of dots is defined, and the user is able to create groups of dots by dragging loops around them in prime increments. Groups can then be nested inside of other groups with subsequent drag operations. Groups can also be shortened or eliminated by clicking dots at prime increments inside the last group. The prime factors used for groupings are displayed along the top and left of the grid, with multiplication statements that show the total length and width of the grouped area. The total area, which is the product of the prime factors, is displayed in the upper left corner of the grid.
There are several display options for the grid. The total area, length of the sides, and prime factors can be turned on and off. Also, although the grid pitch automatically adjusts to ensure enough room to cover the entire grid without overlapping loops, it is possible to set the spacing manually by specifying the number of loops expected on the grid.
The examples below demonstrate different capabilities of the interactive. Some of those capabilites are configured using search parameters in the URL. Note the search parameters in the examples and click over to the Documentation tab for a complete explaination of the configuration options with URL examples.
Prepopulated with Loop Spacing
Prepopulate the grid with neested groups and explicitly set the spacing of the grid to accommodate enough loops.
Try it!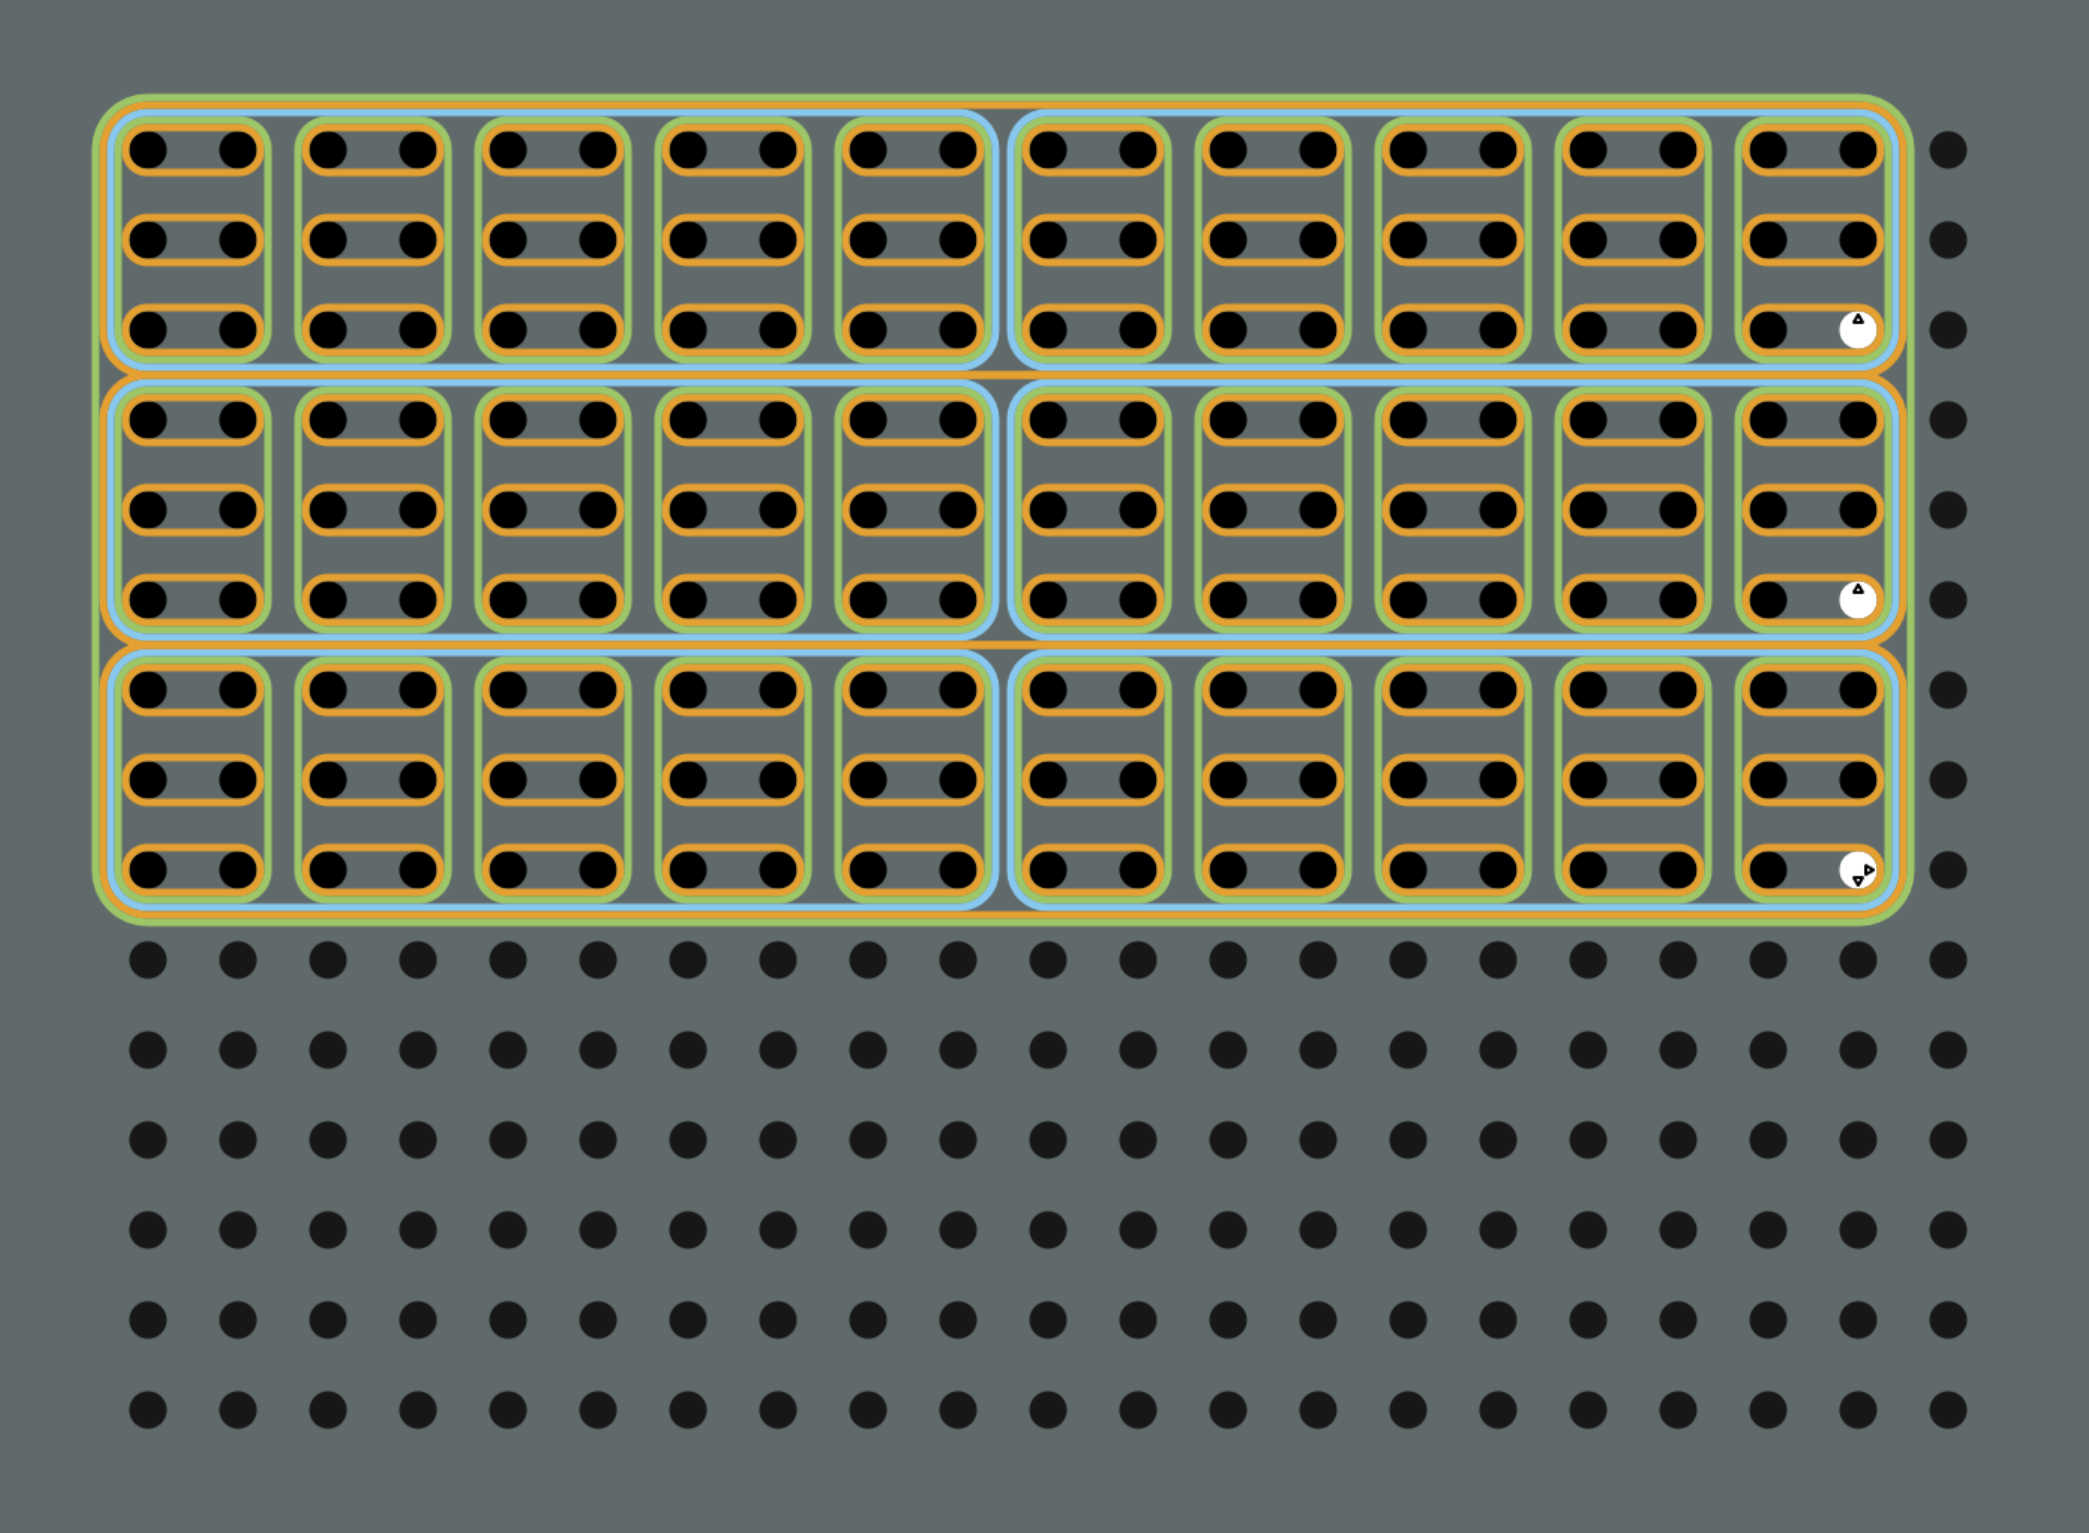
Basic Usage
The required parameter in the URL is the grids=X.Y_M.N, where X.Y specifies the location, in pixels of the first
dot in the grid and M.N specifies the width and height of the grid in dots. Once the grid is generated, the user is
presented with first dot that has a right and down arrow. The user can click this dot and drag the mouse to the right or
down to create a new group. Subsequent groups are formed in the same way. Groups may be reduced in size or removed by
clicking the white dots with left or up arrows.
The grid may be configured to display an initial set of groups. Also, the spacing between the dots may be controlled by
specifying the maximum number of loops the grid should display without overlapping.
- nested-groups-grid.html?grids=100.100_21.1 (Horizontal 1D Array)
- nested-groups-grid.html?grids=100.100_1.21 (Vertical 1D Array)
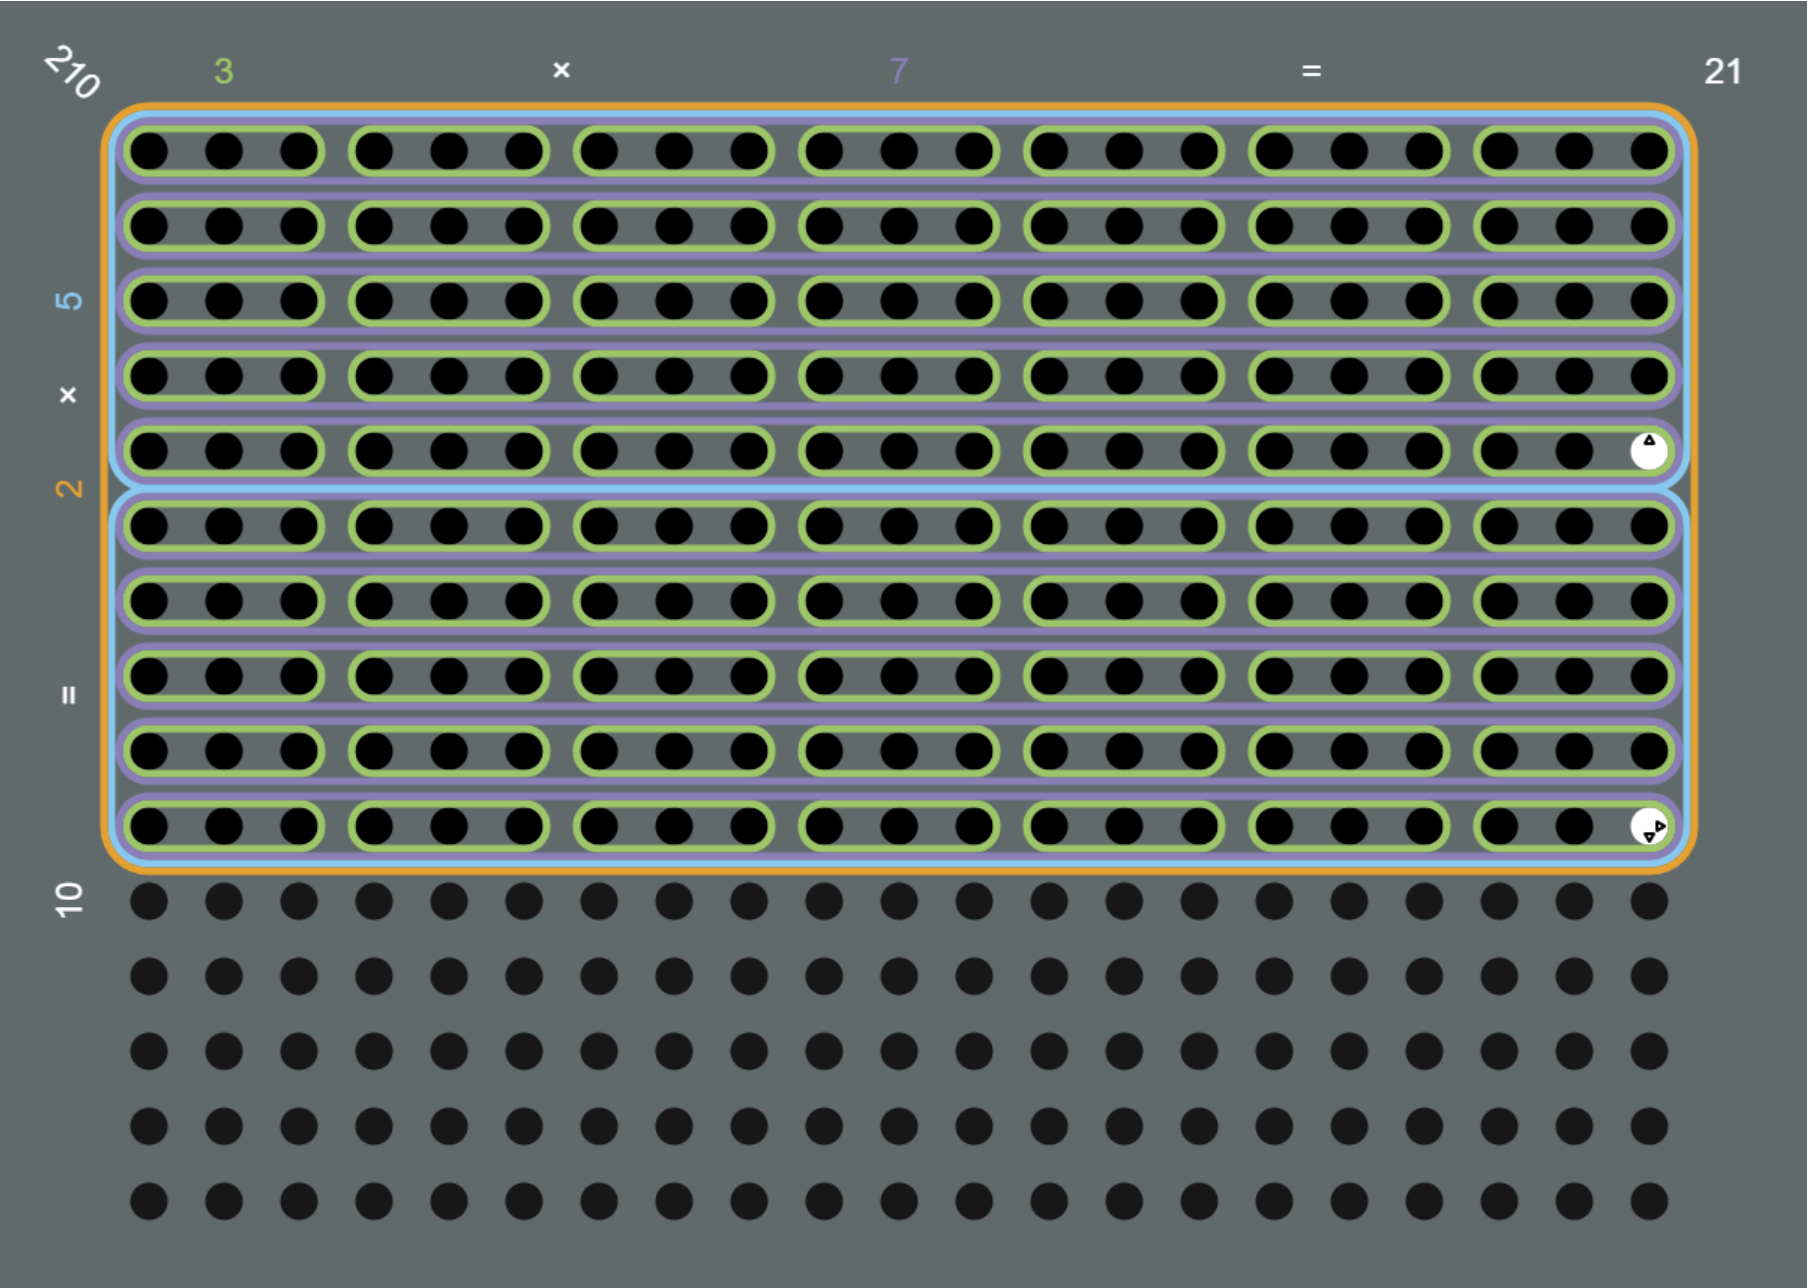
- nested-groups-grid.html?grids=100.100_21.15 (2D Array)
Populated Grids
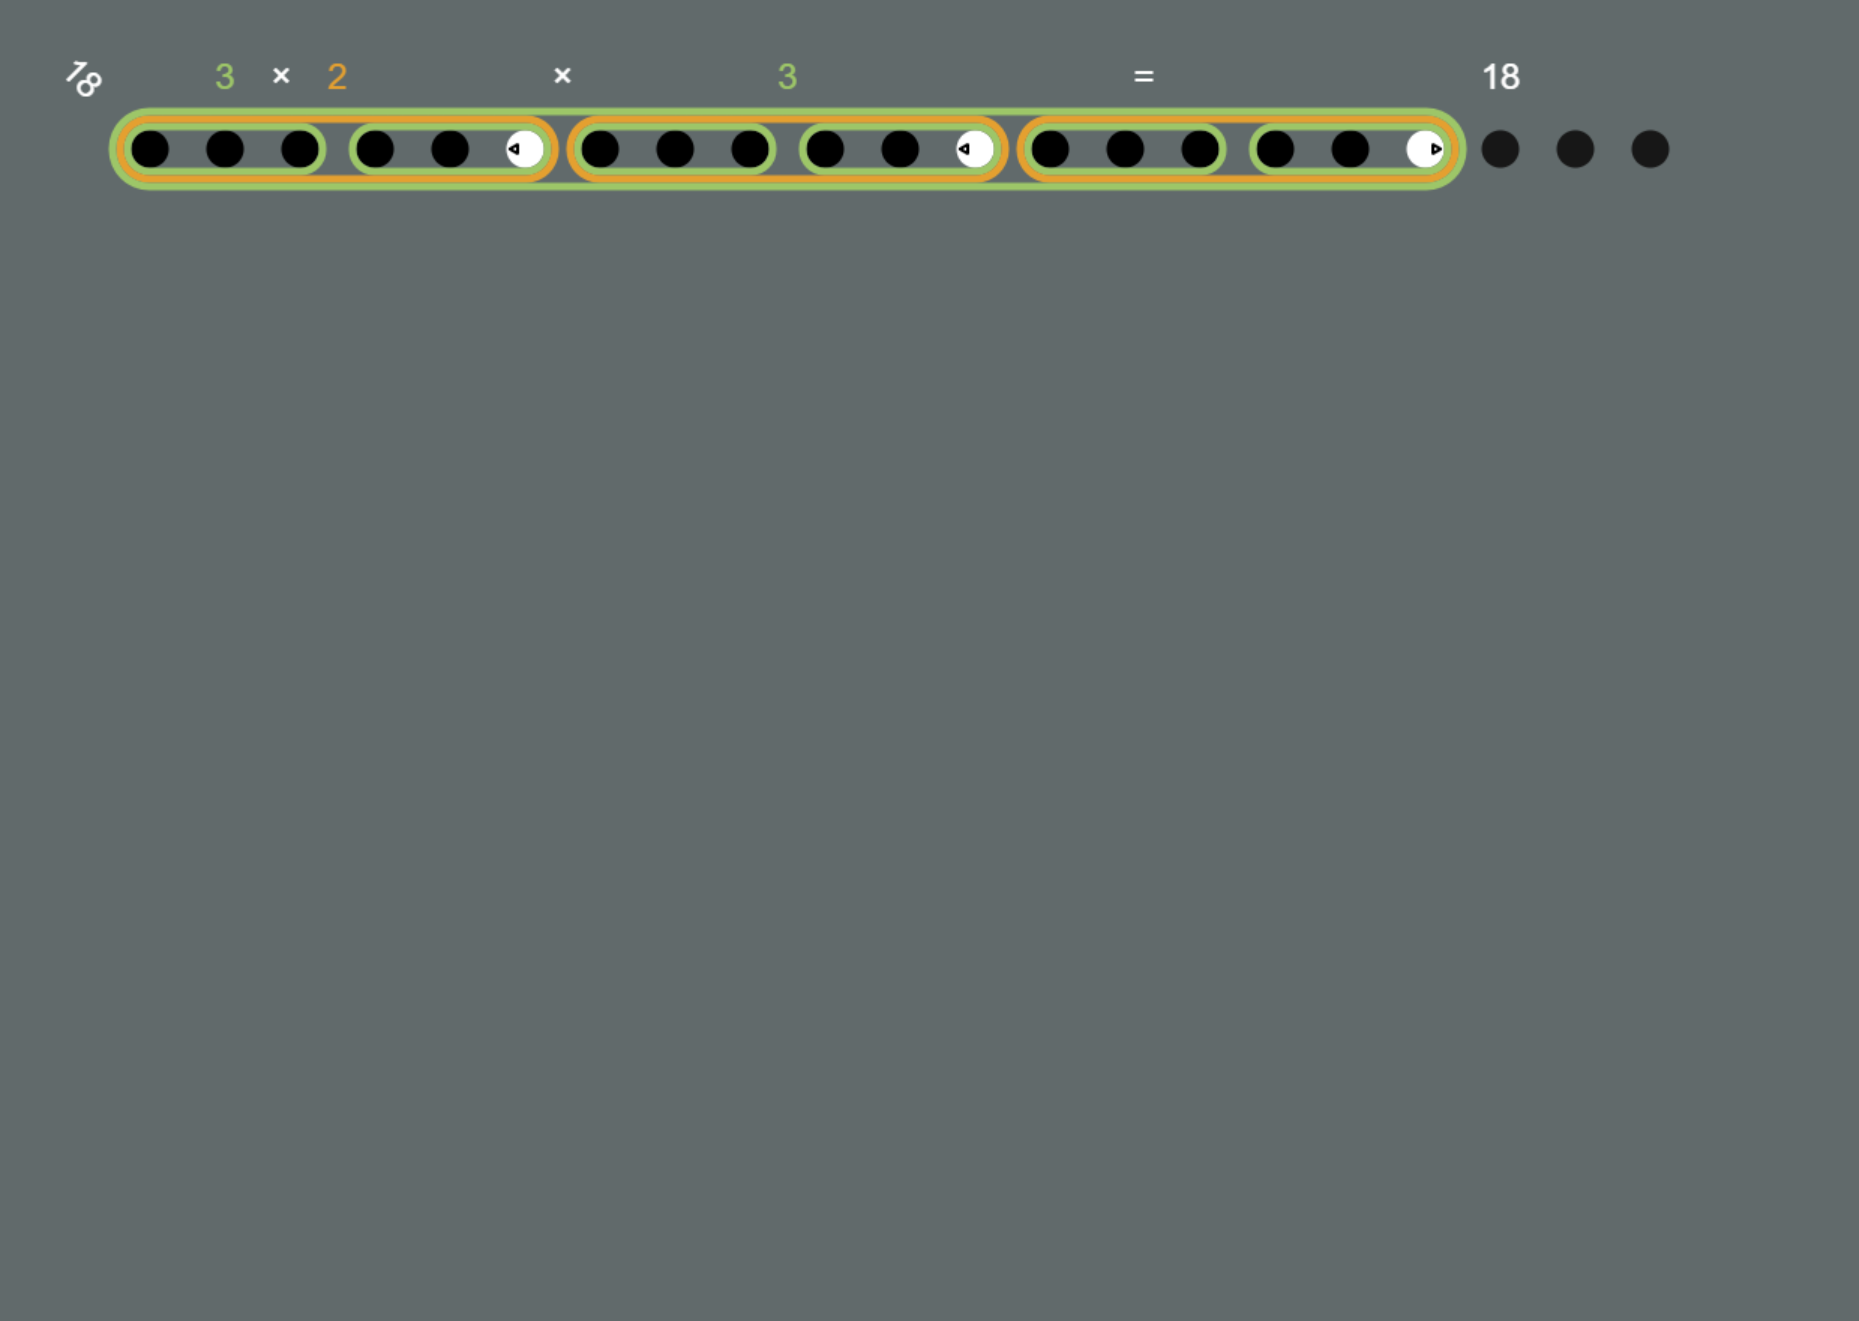
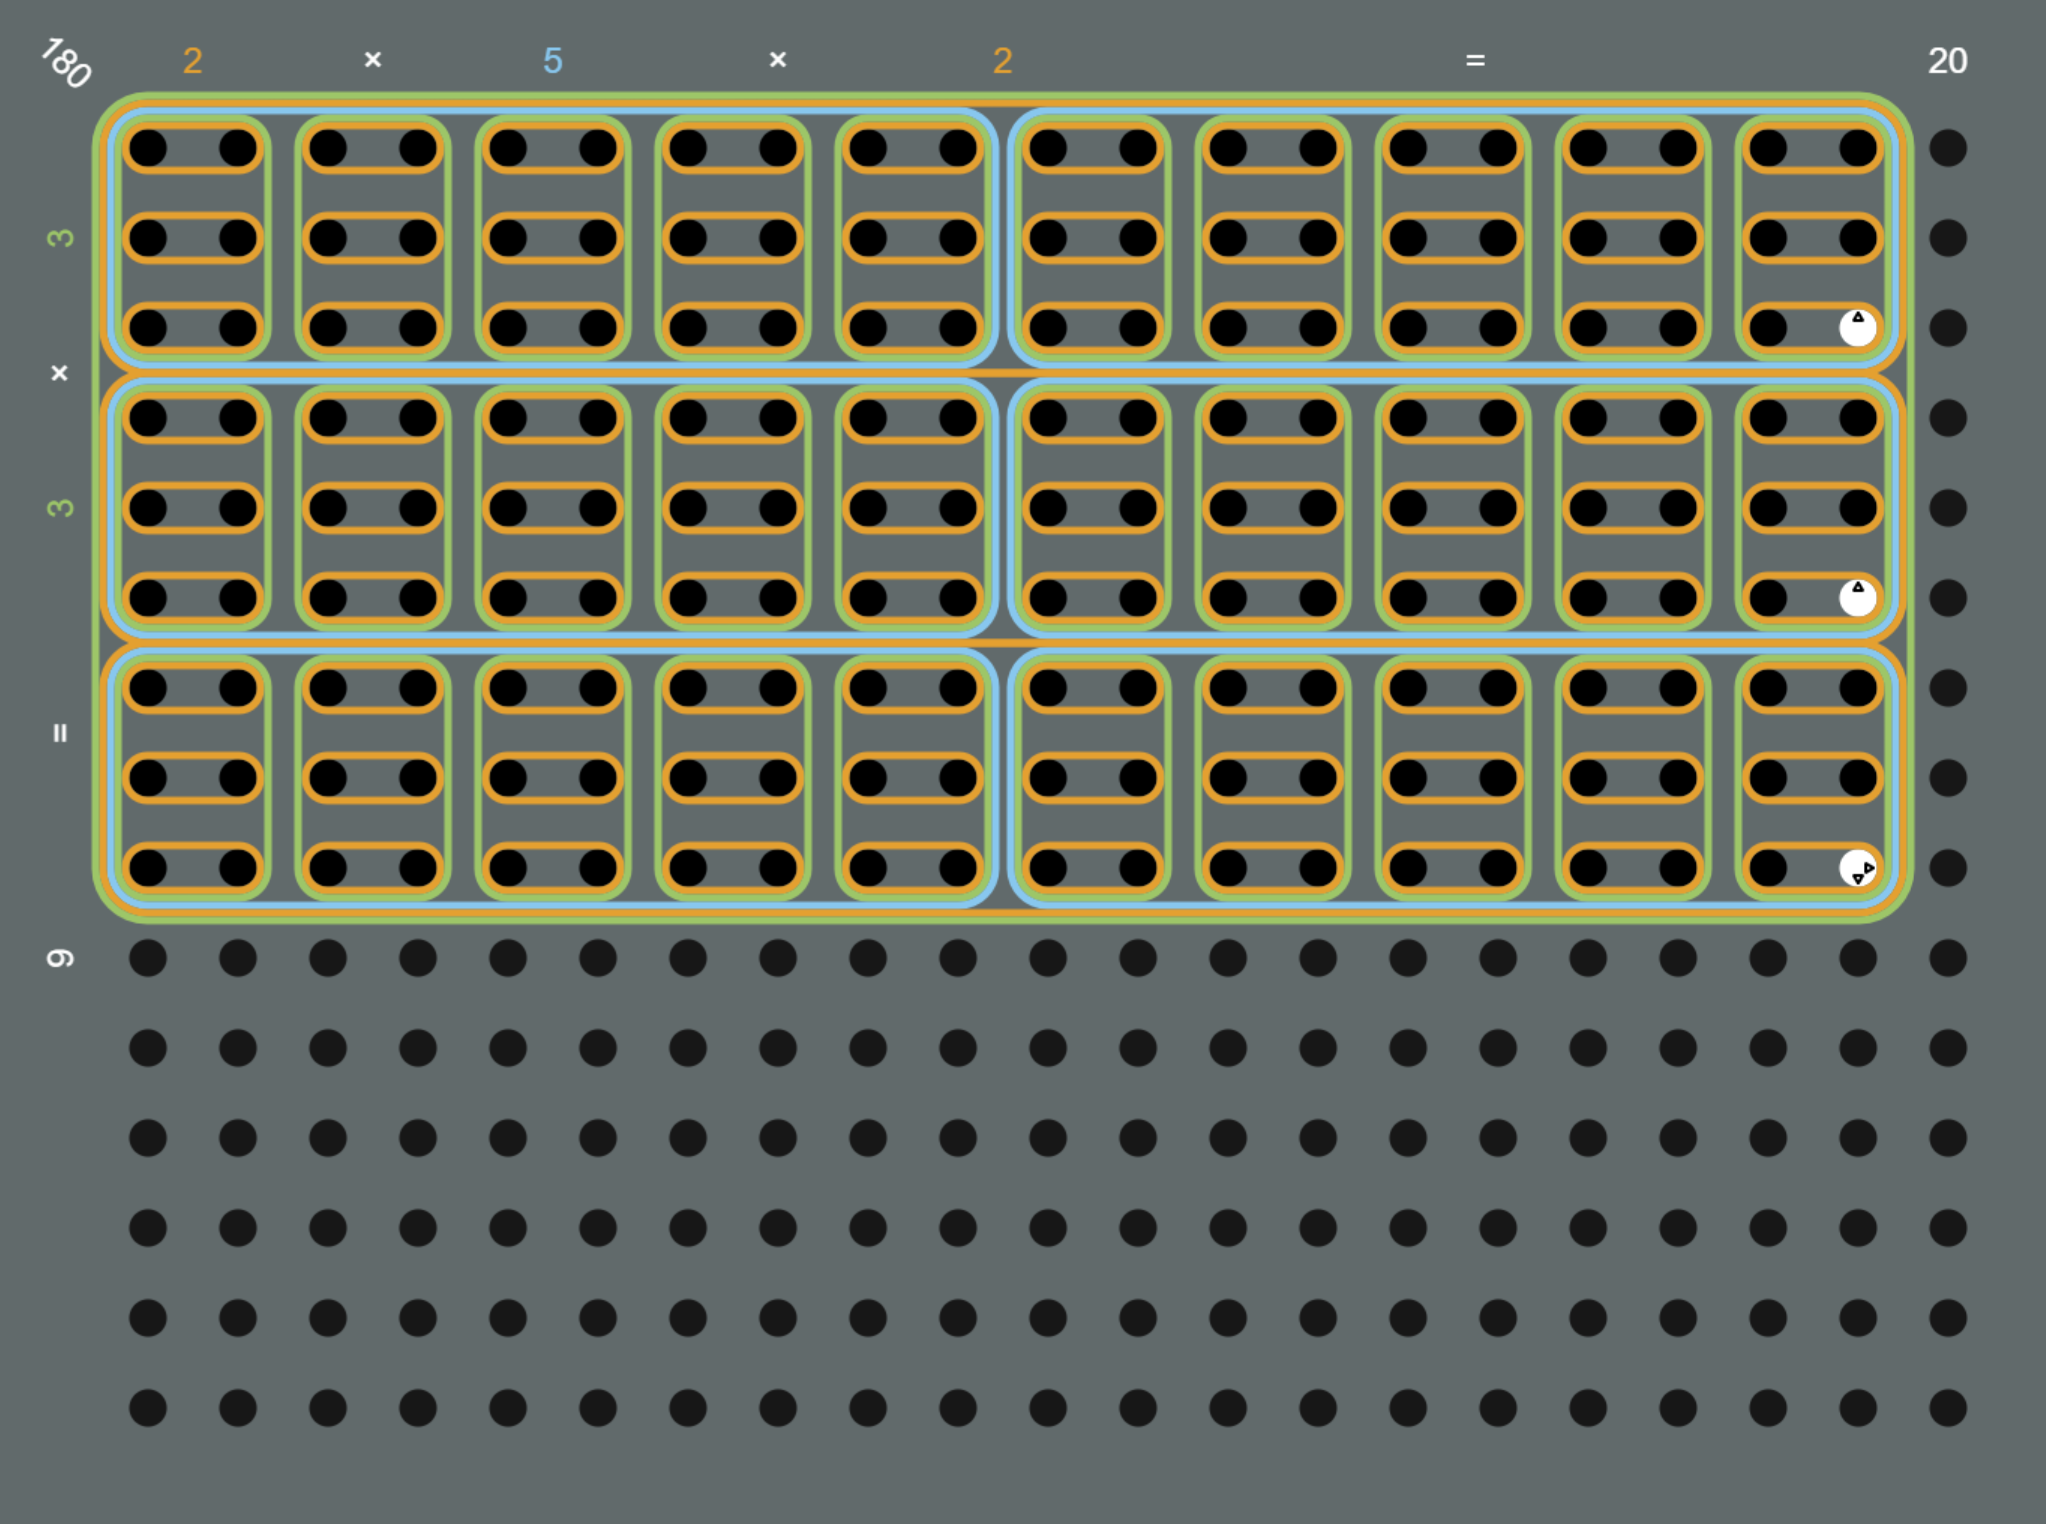
Grids may be populated with nested groups by adding factors to the grids search parameter. Factors are added after the initial grid dimensions by specifying the factor and direction. For example, if one wanted to populate a 20x20 grid with a representation of the number 30 (2x3x5), then they could it by adding the factor of 2 horizontally, 3 horizontally, and 5 vertically. Those factors and directions are encoded as a number (the factor) and letter (h or v) separated by a period. This example would use the search parameter: grids=100.100_20.20_2.h_3.h_5.v
Example URIs:- nested-groups-grid.html?grids=100.100_20.20_2.h_3.h_5.v (Prepopulated 2D array)
- nested-groups-grid.html?grids=100.100_21.15 (Prepopulated 1D horizontal array)
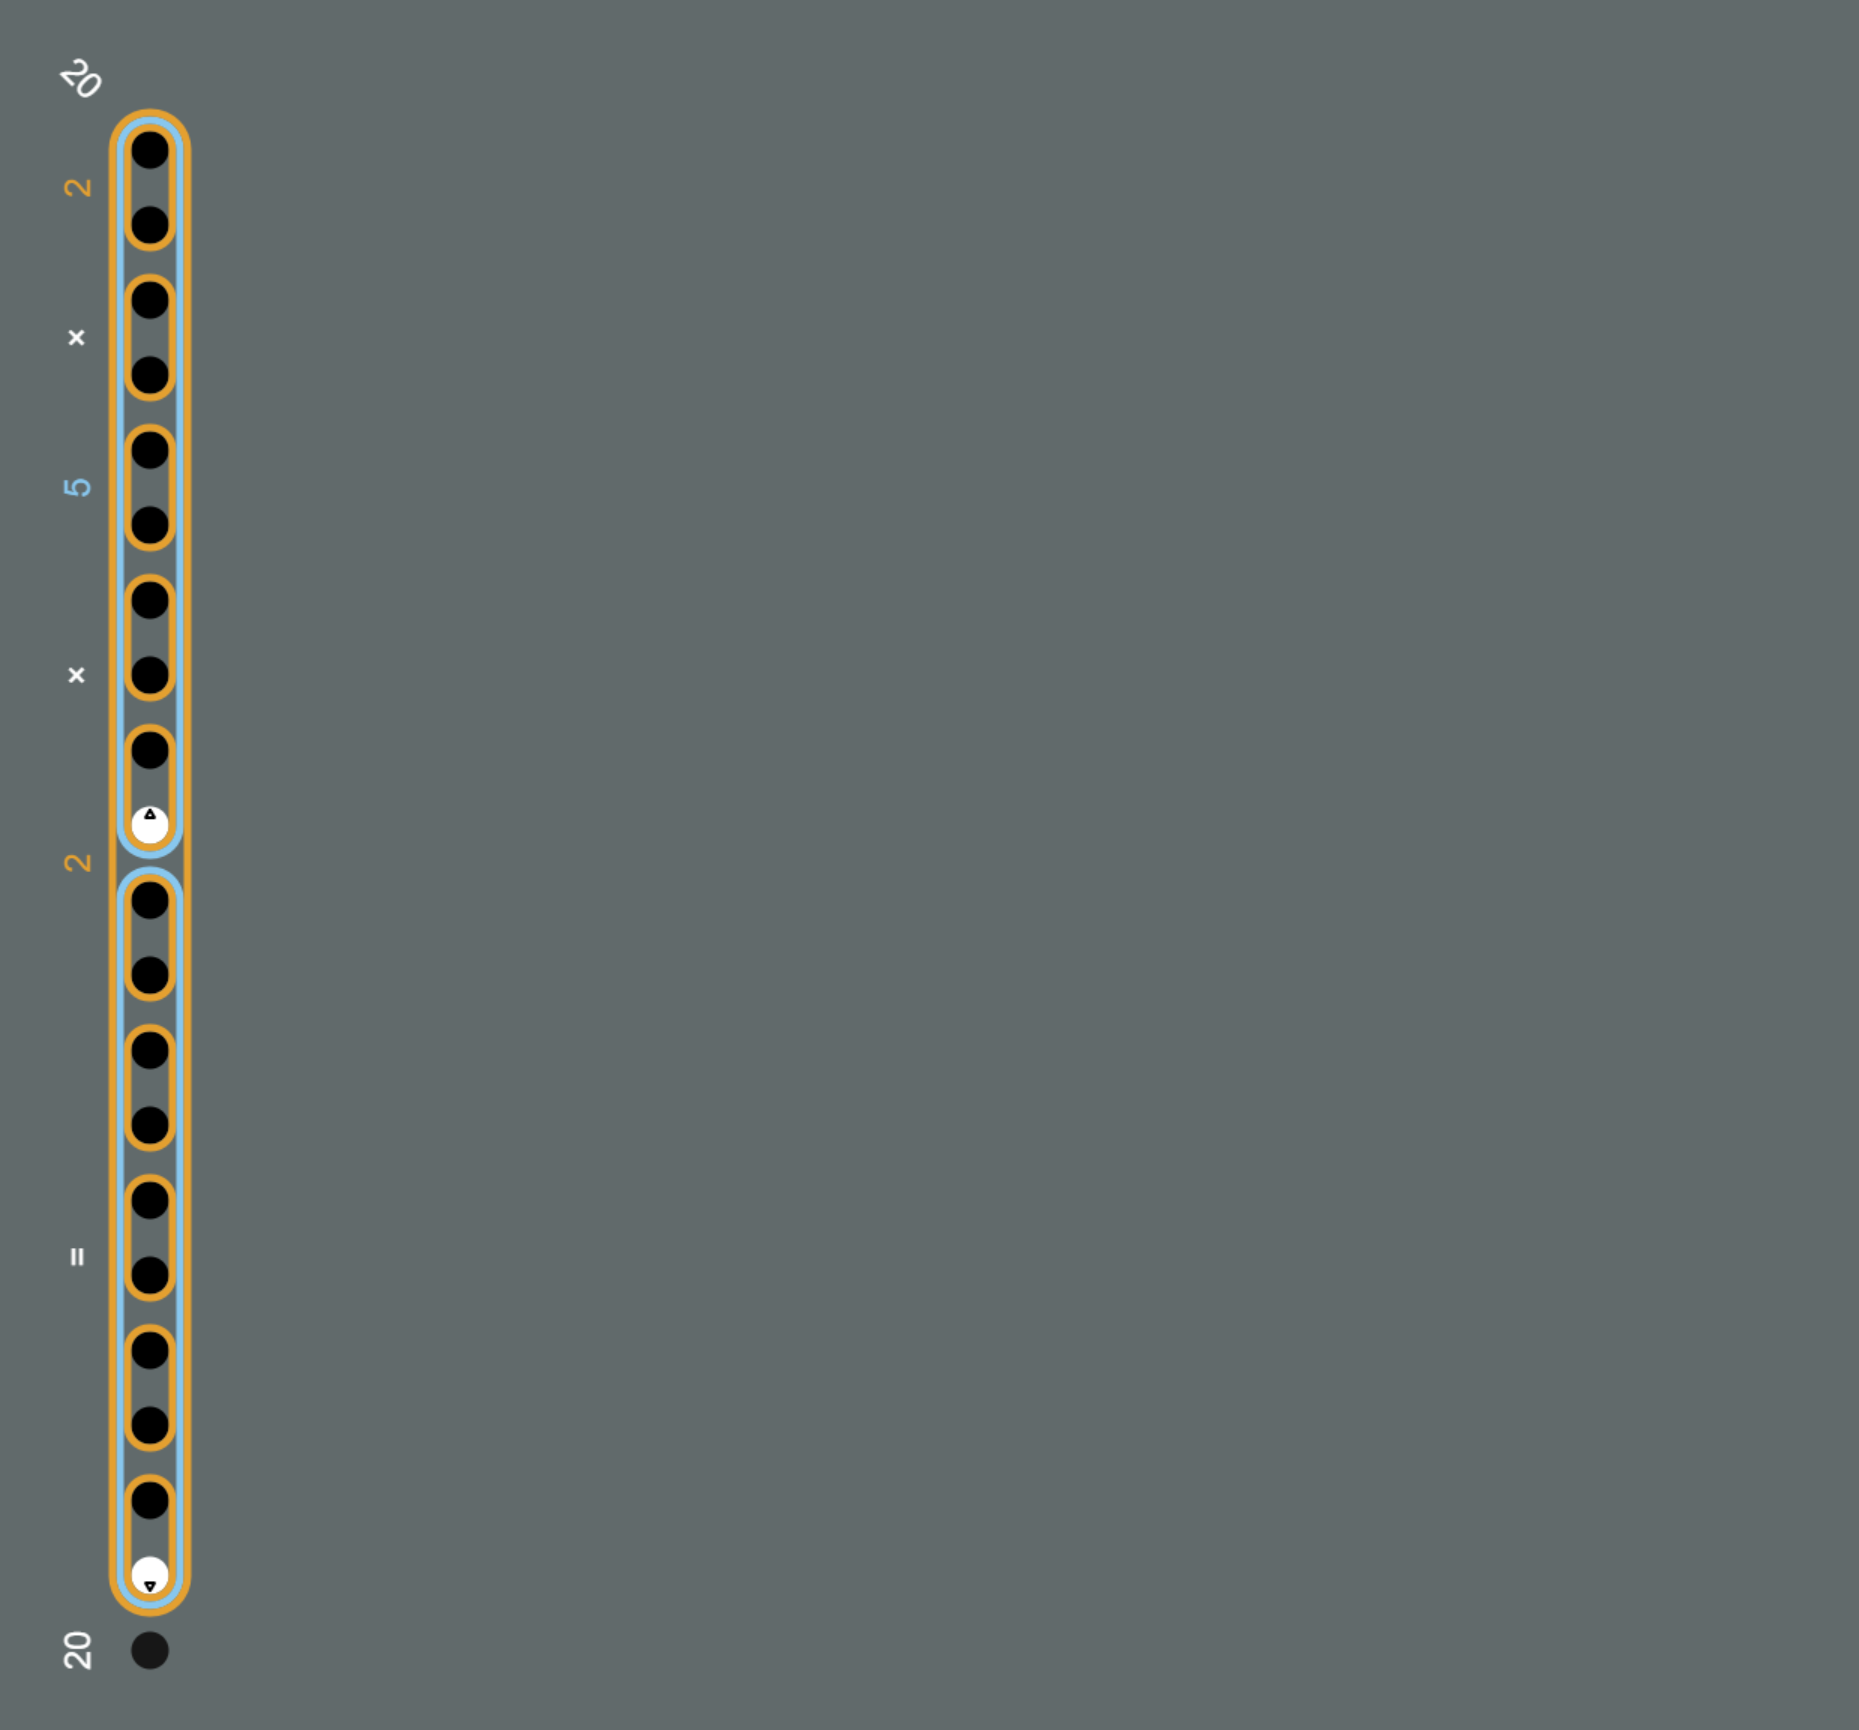
- nested-groups-grid.html?grids=100.100_1.10_2.v_5.v (Prepopulated 1D vertical array)
Grid Spacing
The dots on the grid are automatically spaced to allow for completely nesting all the dots without allowing the loops to overlap. However, there may be situations where one would prefer to reduce or increase the grid spacing. This could be because the user is not expected to nest the entire grid, but is expected to create a number with more prime factors than the total grid. For example, a grid of 11x23 would only requre two groups to nest; but, creating number 128 on that grid would require spacing for seven groups. The grid spacing could be expanded to allow seven groups by adding the search parameter loops=7. Conversely, a 16x16 grid would automatically create space for loops around eight groups. However, the user may be using that grid to explore ways to create the number 12 (which only reqruires three groups). The spacing for the grid could be reduced by spcifying loops=3. Note that there is a minimum spacing set for the grid, to prevent the dots from getting too close together for aestetic reasons. So, specifying smaller numbers in the loops parameter may not always result in a smaler dot pitch.
Example URIs:- nested-groups-grid.html?grids=100.100_11.23_2.h_2.v_2.h_2.v_2.h_2.v_2.v (Overlapping loops)
- nested-groups-grid.html?grids=100.100_11.23_2.h_2.v_2.h_2.v_2.h_2.v_2.v&loops=7 (Increased spacing)
- nested-groups-grid.html?grids=100.100_16.16_2.h_3.h_2.v (Excess spacing)
- nested-groups-grid.html?grids=100.100_16.16_2.h_3.h_2.v&loops=3 (Reduced spacing)
Display Options
By default, the horizontal and vertical prime factors are displayed above and to the left of the grid, respectively. Also, the total width and height
of the grouped area is displayed as multiplication statements above and to the left of the grid, respectively. Finally, the total number of grouped
dots is displayed in the upper left corner of the grid. These labels can be hidden using the search parameters: area=false, primes=false,
and sides=false.
The parameter area=false hides the total of grouped dots in the upper left of the grid. The parameter sides=false leaves the primes factors
displayed on the sides of the grid, but hides the multiplication statement for the width and height. Setting primes=false hides the prime factors and
the multiplication statement along the sides, but leaves the total in the upper left corner of the grid.
- nested-groups-grid.html?grids=100.100_12.12_2.h_3.v_2.h (Display everything)
- nested-groups-grid.html?grids=100.100_12.12_2.h_3.v_2.h&area=false (Hide the total)
- nested-groups-grid.html?grids=100.100_12.12_2.h_3.v_2.h&sides=false (Hide the multiplication statements)
- nested-groups-grid.html?grids=100.100_12.12_2.h_3.v_2.h&primes=false (Hide the prime factors and multiplication statement)
- nested-groups-grid.html?grids=100.100_12.12_2.h_3.v_2.h&area=false&primes=false (Hide all labels)
Multiple Grids
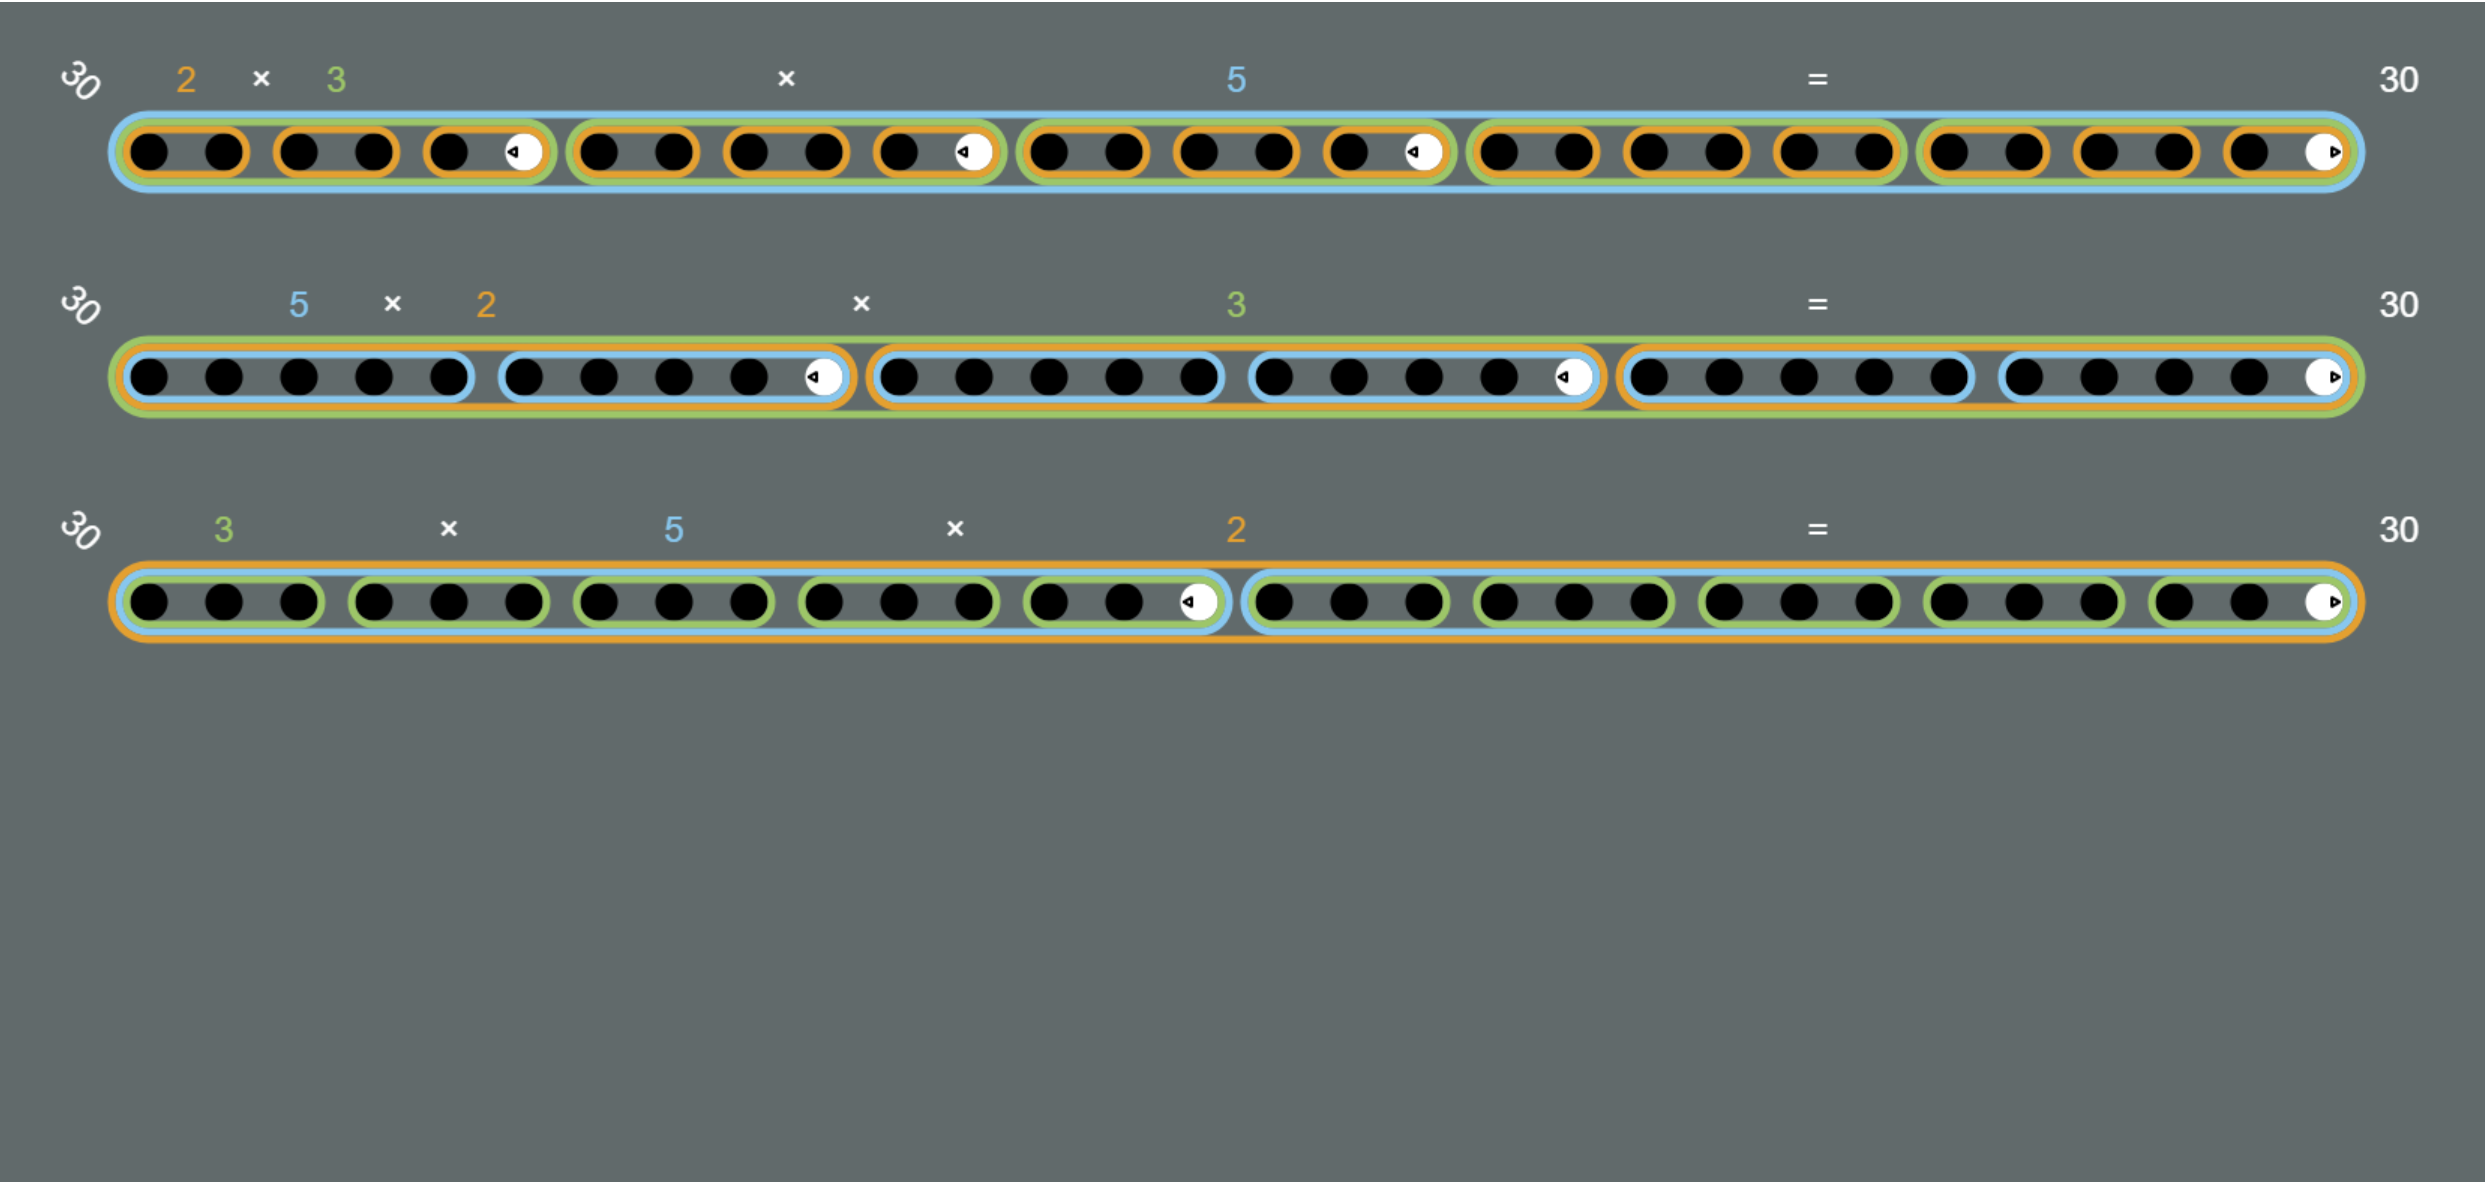
Multiple grids may be presented on a single canvas by adding more grid specifications to the grids parameter, separated by the '~' character. The display options are inherited by all the grids in the interactive. But, the specifications for location, dimensions, and population with groups may all be different. In the examples below, notice how the '~' character separates different grids, and how the starting location for each grid changes to place them in different areas of the canvas to avoid overlap.
Example URIs:- nested-groups-grid.html?grids=100.100_30.1~100.250_30.1~100.400_30.1 (Horizontal 1D grids)
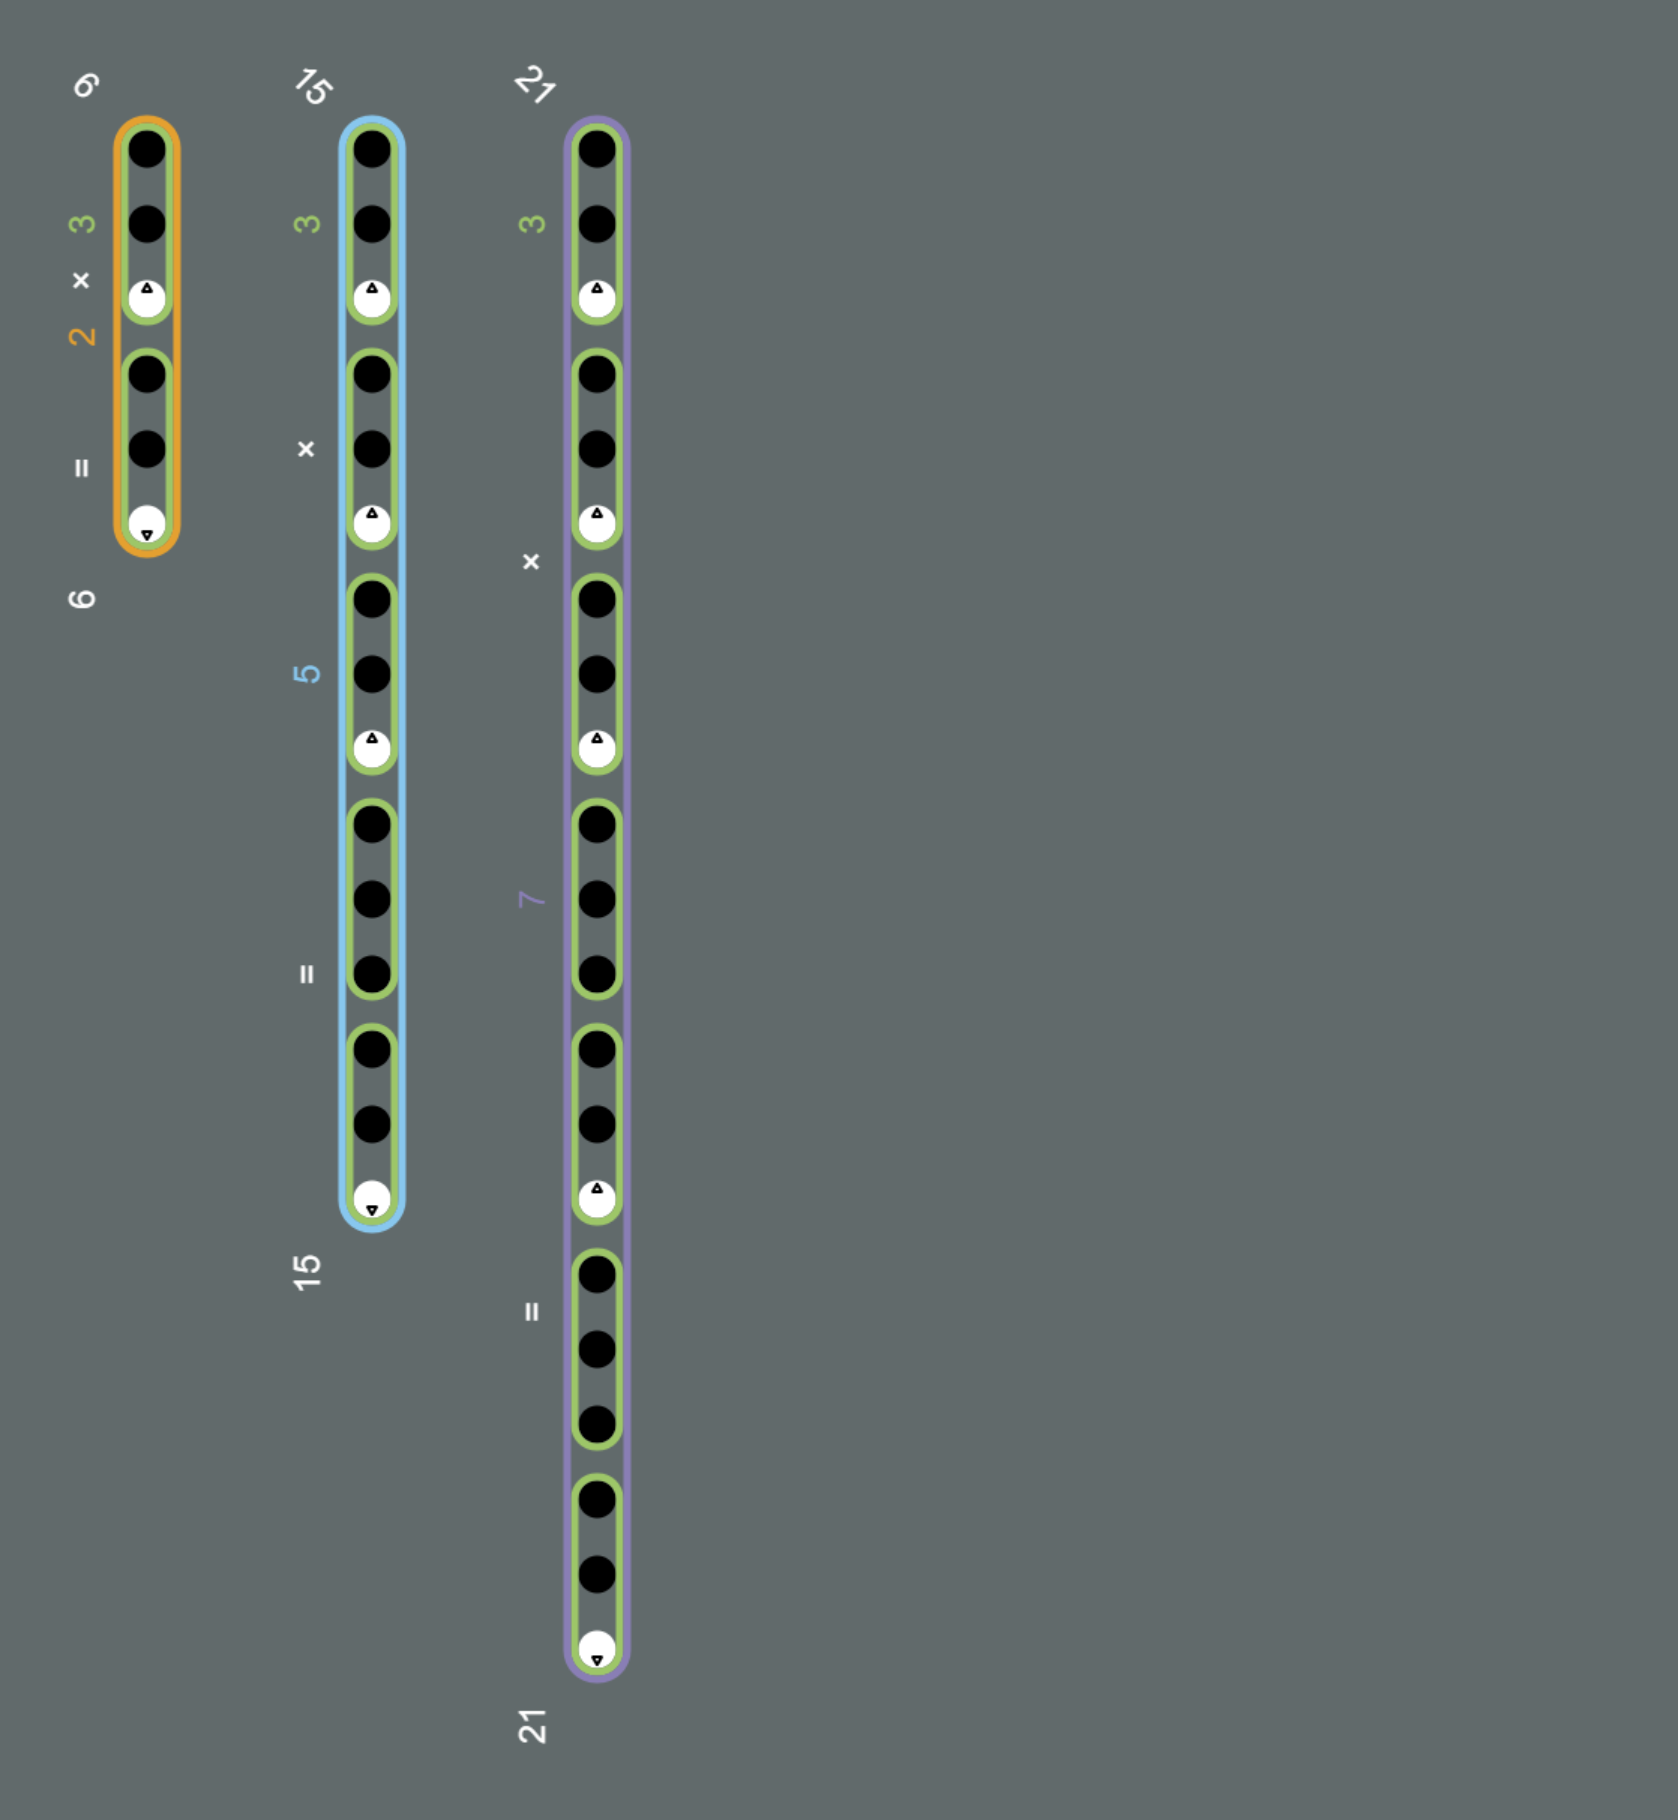
- nested-groups-grid.html?grids=100.100_1.6~250.100_1.15~400.100_1.21 (Vertical 1D grids)
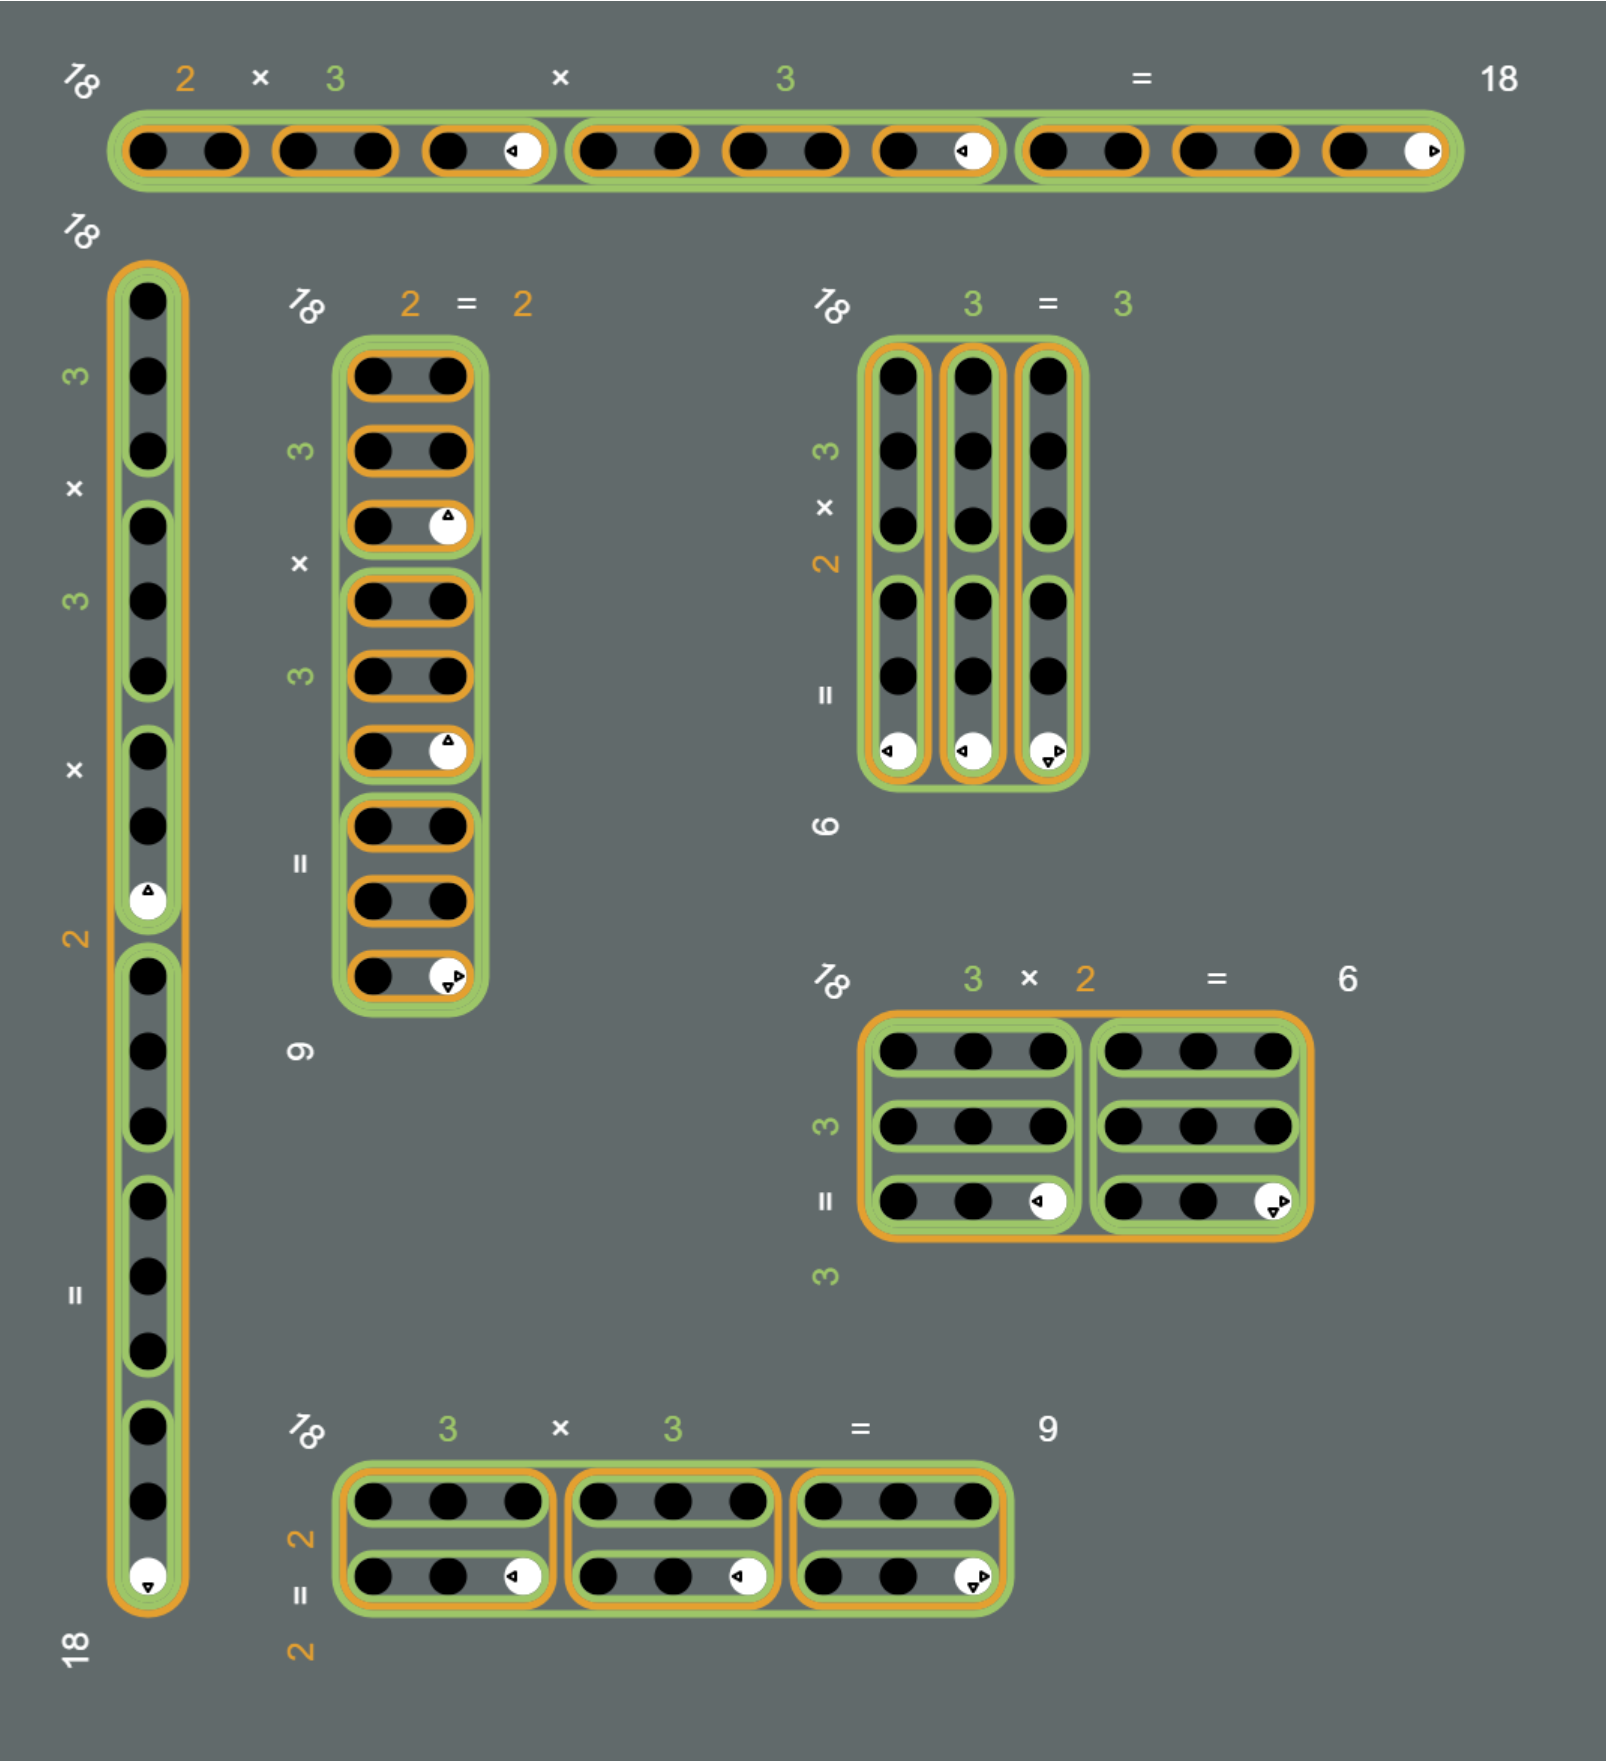
- nested-groups-grid.html?grids=100.100_18.1~100.200_1.18~250.250_2.9~600.250_3.6~600.700_6.3~250.1000_9.2 (Various 1D and 2D grids)